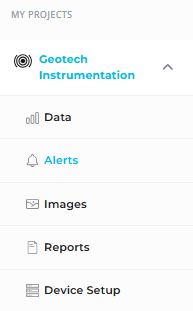
Settings and subscriptions for alert notifications on your projects can be managed on the Alerts page (found under each project).
The page has three tabs:
Note: Subscriptions are opt-in. Users are responsible for subscribing to the alerts they want to receive. This ensures that each user only gets notifications relevant to their role or area of responsibility, and prevents unnecessary or duplicate alerts from flooding inboxes or phones.
Make sure to review your project’s alerts and subscribe to any that are critical for your work.
Subscriptions
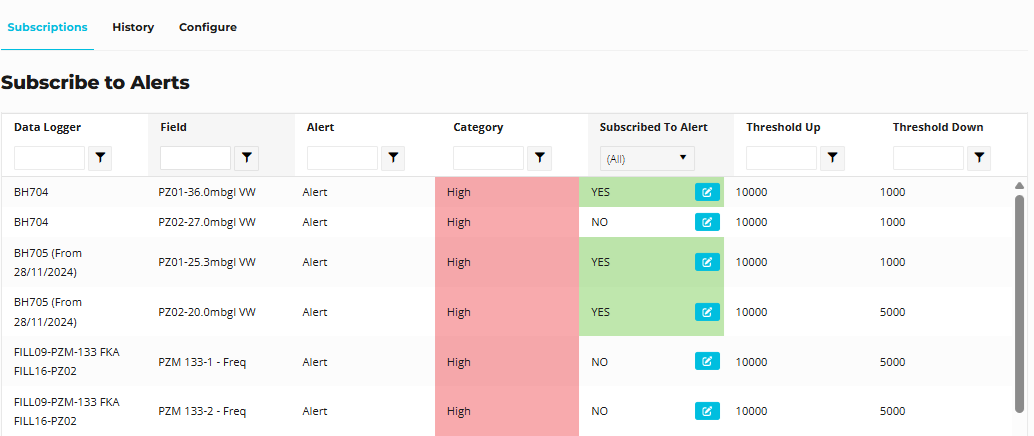
The Subscriptions tab shows all existing alerts that have been created for the project.
- Each alert includes:
- Alert name
- Category (High, Medium, Low)
- Thresholds (up and/or down values)
- Subscription status
Subscribing to an Alert
- Click the blue edit button in the Subscribed to Alert column.
- A modal window will open.
- Toggle the Subscribe to Alert switch to the ON (blue radar icon) position.
- Set a Cooldown period (or leave default of 240):
- This defines how long to wait in minutes before sending additional notifications for the same trigger.
- Helps reduce nuisance alerts (e.g., “Once I get a notification, I don’t need another for 3 hours.”).
- Choose how you’d like to be notified:
- SMS
- Or both
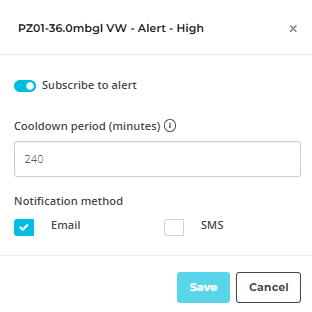
- Click Save. You are now subscribed to the alert!
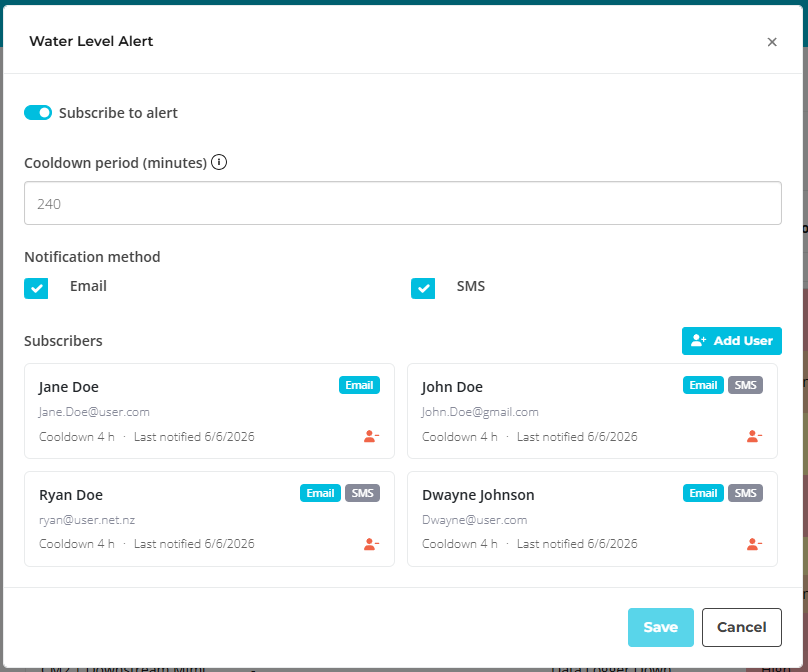
Adding Other Users to an Alert
From the same subscription modal, you can add additional recipients:
- Existing Cirro users (within the project)
- External users (no Cirro account required)
To add a user:
- Click Add User
- Select Internal User External, then enter user details:
- Save
External users will receive email notifications only. SMS is not available for external recipients.
Once added, they will:
- Receive a confirmation email indicating they’ve been subscribed
- Begin receiving alert notifications based on alert conditions
External recipients can unsubscribe at any time using the unsubscribe link in alert emails.
You can also view a list of all subscribed users under each alert.
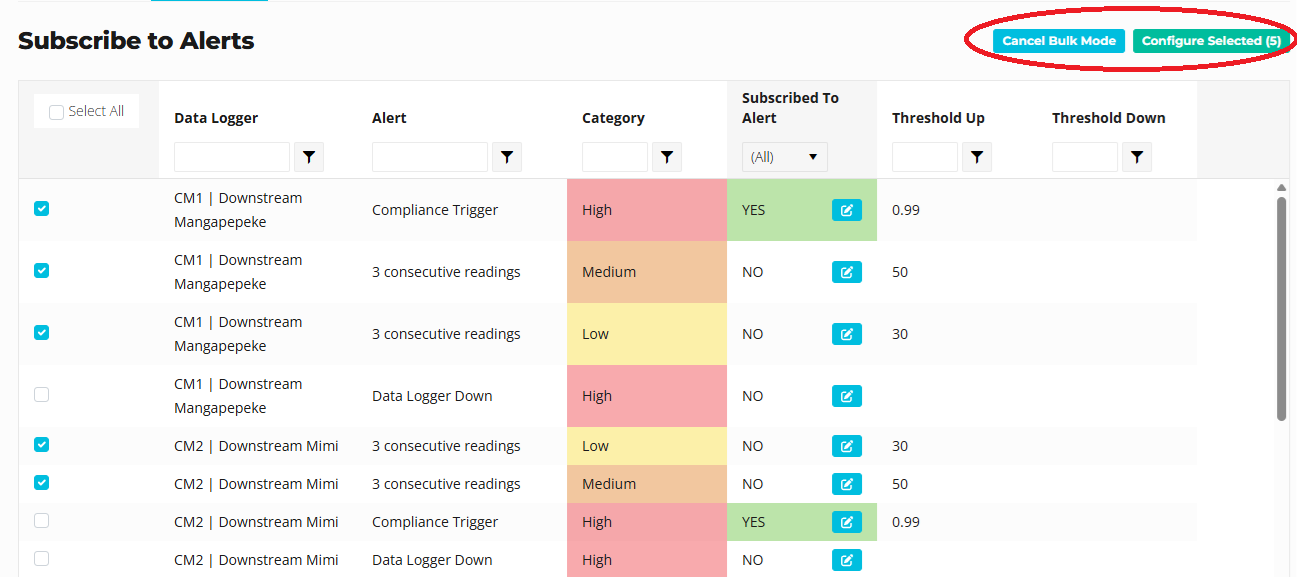
Bulk Alert Subscriptions
Bulk subscriptions make it easier to manage alert access across projects that contain a large number of alerts.
Instead of subscribing to alerts individually, users can:
- Subscribe to multiple alerts at once
- Apply subscriptions across a project in a single action
- Quickly align alert visibility for teams or roles
This is particularly useful for:
- New team members joining a project
- Standardising alert access across roles
- Onboarding external stakeholders
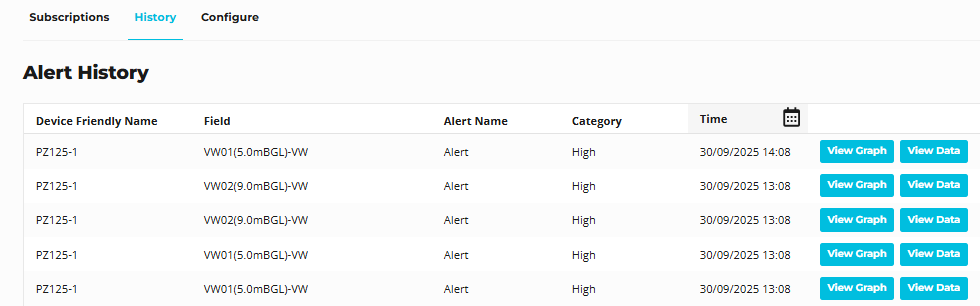
History
The History tab displays a log of all alerts that have been triggered for the project.
- You do not need to be subscribed to an alert in order to view it in the history.
- Each entry includes details such as the alert name, category, threshold, and trigger time.
Filtering by Date
- In the Date column, click the calendar icon to filter the log by a custom date range.
- This is handy when you want to:
- Review alerts during a specific event or site condition.
- Narrow down the list to a particular monitoring period for reporting.
Viewing Alert Context
For each logged alert, you can:
- View Graph → Jump directly to a graph showing the data leading up to and around the time the alert was triggered.
- View Data → Open the same time range in a table format for a detailed data review.
This makes it easy to investigate what was happening in the dataset at the moment an alert was raised.
Configure - Setting up Alerts
The Configure tab allows you to create new alerts or modify existing alert settings for your project.
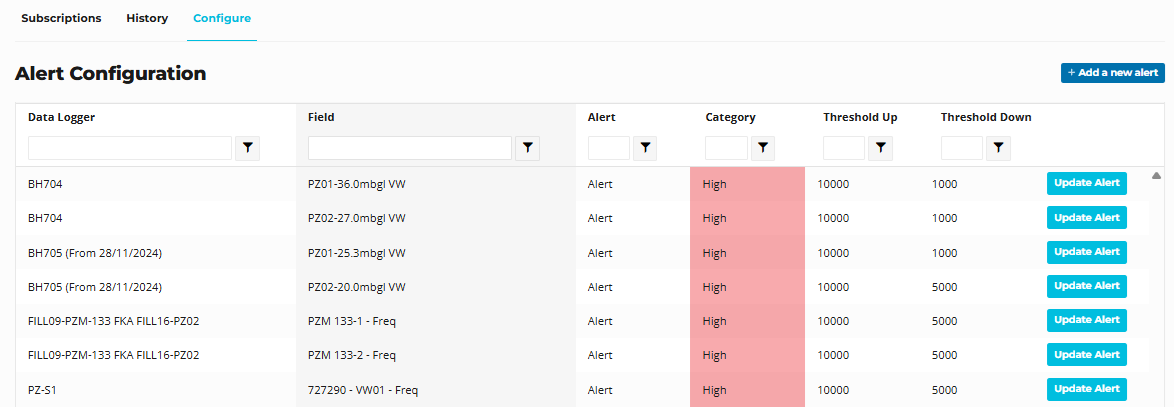
Editing an Existing Alert:
- Scroll through the table to find the alert you want to edit, or use the search boxes to quickly locate it.
- Click the Update Alert button next to the alert.
- A modal window will open where you can modify settings such as
Creating a New Alert:
- Click the Add a New Alert button in the top-right corner.
Set Alert Details
These fields are common for all alert types:
- Alert name
A freeform label for your alert.
Example: “Piezometer high water level.”
- Category
Choose from Low, Medium, or High (yellow, orange, red) to classify the importance.
This does not affect when the alert triggers
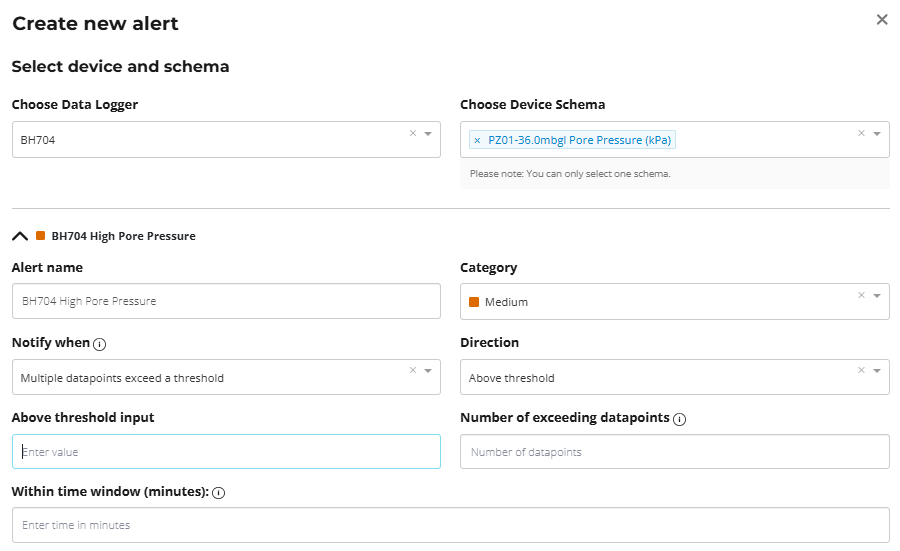
Choose When You Want to Be Notified
The “Notify me when” dropdown sets the type of condition that triggers your alert.
Options:
- A single datapoint exceeds a threshold
→ Triggers immediately when one reading is above or below the set limit.
Example: “Alert if water level goes above 2.0m at any time.”
- Multiple datapoints exceed a threshold
→ Triggers only when several readings exceed the limit within a set timeframe.
Example: “Alert if water level goes above 2.0m three times within one hour.”
This setting is useful for reducing false alarms caused by short-term spikes or sensor noise.
A single rogue reading might temporarily exceed a threshold, but only sustained or repeated breaches indicate an issue worth notifying.
Define the Trigger Condition
If you chose “Single datapoint exceeds a threshold”
- Select the direction:
- Above threshold
- Below threshold
- Outside a range (advanced)
- Enter the threshold value(s).
- (Optional) Repeat alert if condition persists
- If the value stays outside the threshold, set how many readings to skip before sending another notification.
- 0 = Notify only once until the value returns to normal.
- N = Skip N readings before resending the alert.
If you chose “Multiple datapoints exceed a threshold”
- Select the direction:
- Above threshold
- Below threshold
- Enter the threshold value.
- Enter the Minimum breaches required
- The number of readings that must exceed the threshold before triggering the alert.
- Example: If set to 3, the alert triggers after three readings above the threshold.
- Enter the Timeframe
- How long the system should look back for breaches.
- Example: “3 breaches within 60 minutes.”
You can click Add Alert to create additional alerts for the same schema (e.g., Low, Medium, High).
Once you’ve finished configuring your alert(s), click Save.
Don’t forget to visit the Subscriptions tab to subscribe to the new alert so you’ll receive notifications.