In this tab, you can view your data in a table format and export it as a .CSV file.
Note: A new feature allows direct export of data from the Time Series Graph page as well.
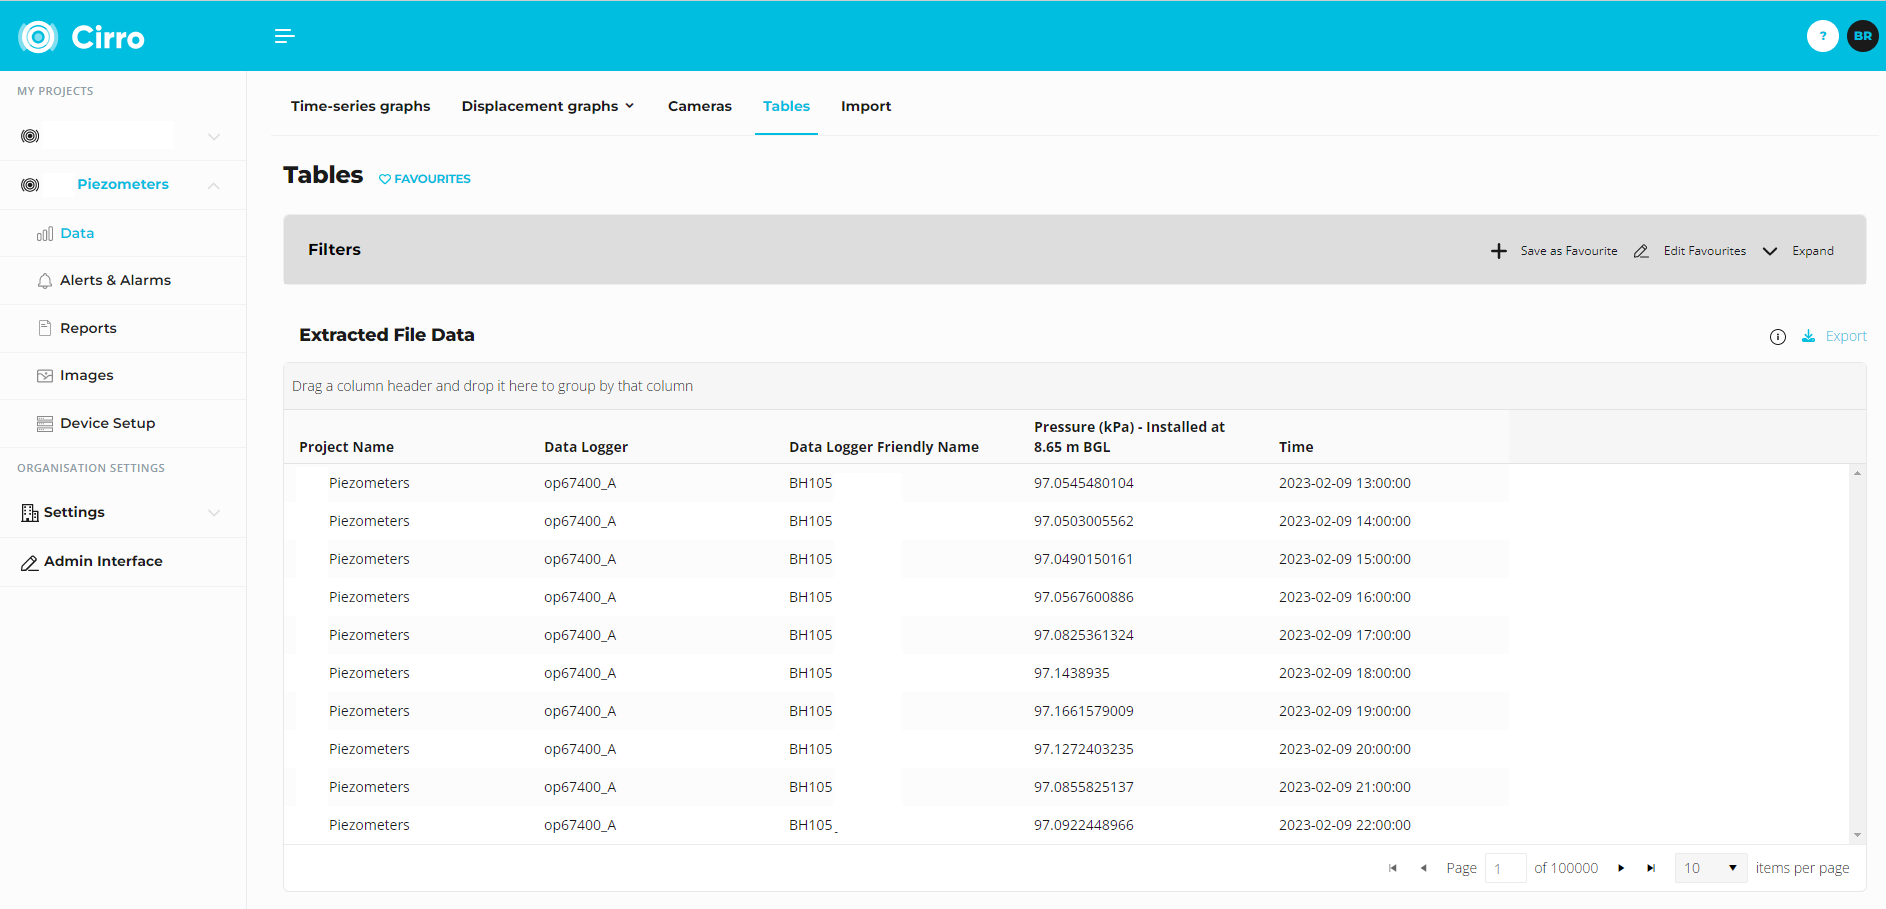
The process is similar to creating Time Series Graphs:
Steps to Generate a Table
- Click the Expand icon to enlarge the selection window.
- Select your datalogger.
- Choose the desired date range.
- Select the data series you want to include in the table (e.g., Time & Pressure).
- Click Search to generate the table.
- You can click on column headers to sort the table by that parameter.
Exporting Data
- Once the table is generated, click Export to download the data as a .CSV file.